
Survey Researcher "From Beginner to Master" Tutorial, Session 5/5
Easy Response Analysis
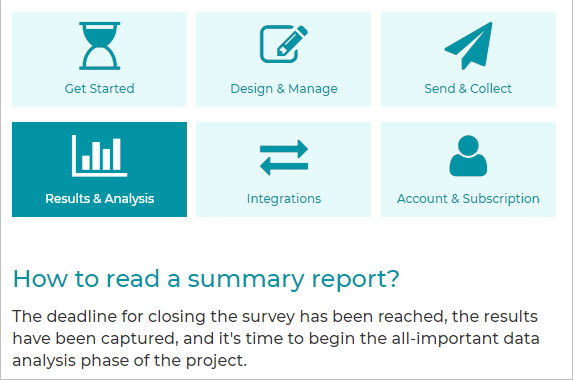
How to Read Survey Results
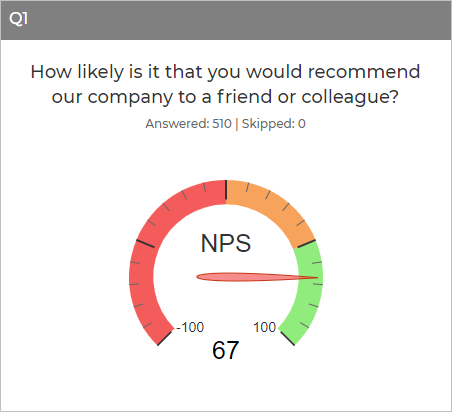
Summary Reports
It's now time to better understand the top line results of your completed survey.
Summary Reports provide an overview of your survey design, collector information, and response time.
These reports are also ideal for sharing with colleagues and other project stakeholders.

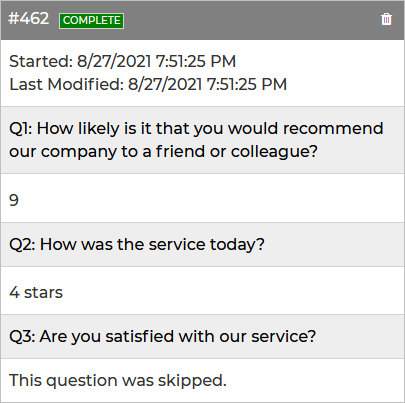
Real-time Responses
You don't need to wait to see the survey responses. Once your survey is completed by a respondent,
you can immediately review their real-time responses and,
if so desired, view earlier responses as well.
What else?
Need additional support for "Results & Analysis?"
Check out Help Center.
Highlights
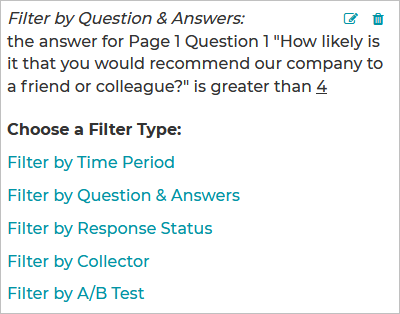
Filter Results
You can apply filters to focus on specific parts of your survey results.
SurveyOL enables you to filter by time period, questions and answers, response status, collector, A/B test.
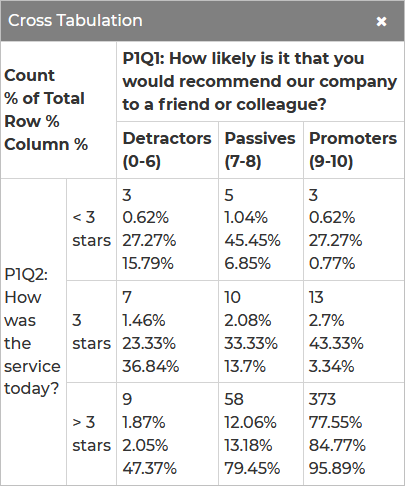
Cross Tabulation
Crosstab reports allow you to easily compare responses across multiple questions in a grid table.
A table shows how many times an answer choice was selected, the Row %, the Column %, and the % of Total.
Available question types for cross-tab reports include Multiple Choice (Single-select or Multi-select),
Image Choice (Single-select or Multi-select), Dropdown, Net Promoter Score (NPS), Star Rating, Scale,
Text A/B Test, and Image A/B Test.
Export Summary Reports
Need to view your reports offline for analysis and future presentations? You can export your summary report with charts in the format of PDF, PPT, or WORD.
Export Real-time Responses
Need to add your finishing touches to the data collected from your survey? The response raw data can be exported in the format of Excel, CSV, or PDF.
No Hassles • No Commitments • No Credit Card Required • Free & Affordable Plans