
A summary report of survey responses, as the name suggests, provides an overview and analysis of the survey response data. SurveyOL's summary report feature allows you to view and analyze your response data in a concise and organized manner, offering valuable insights.
How to read a summary report:
- On the Dashboard page, click on the Result link for your survey.
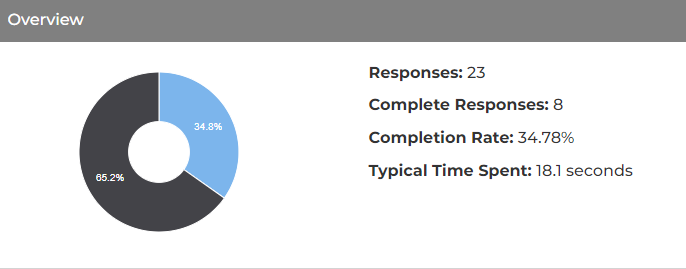
- On top of the Summary Report page, it shows how many responses have been received, the completion rate, and the typical time spent in seconds. The typical time spent is the median time length for completed responses. If none of the responses are completed, it shows "-".
- Except for Text, Image, Text A/B Test, and Image A/B Test questions that don't require answers, every question comes with stats including "answered #" (how many times it is answered), "skipped #" (how many times it is skipped), a response chart and/or a response analysis.
The chart format may vary depending on the question type:
Multiple Choice
Contains a bar or pie chart that indicates how many times each option is answered and what the percentages are.
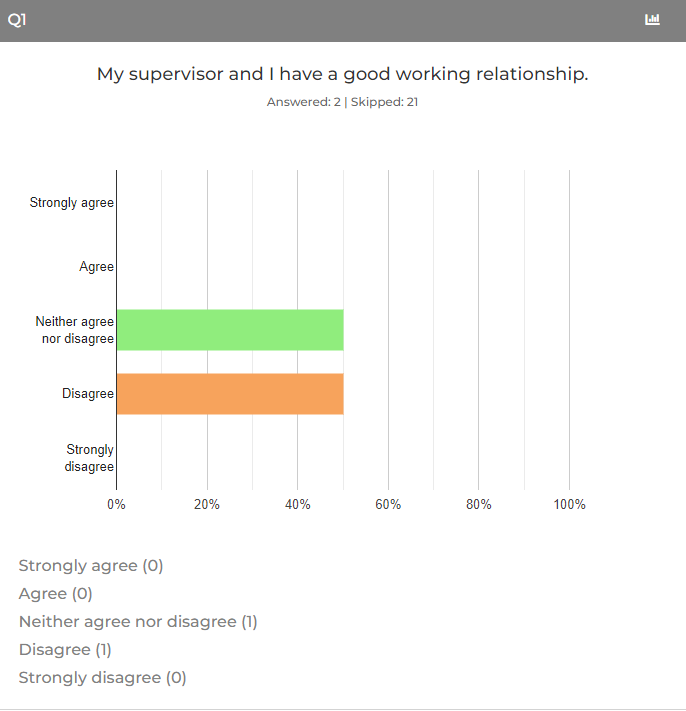
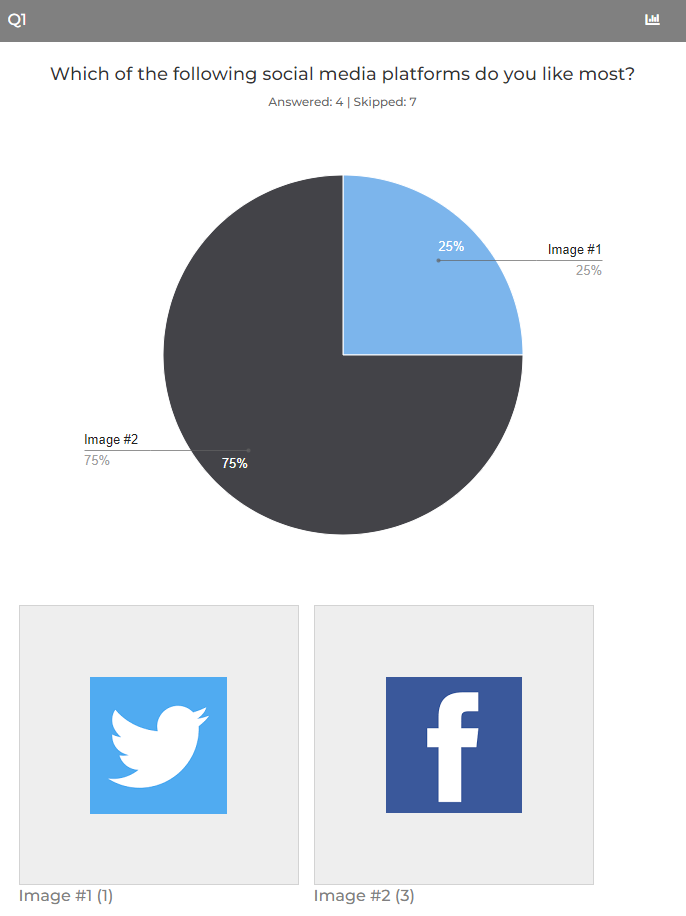
Image Choice
Contains the data that shows how many times each option is answered.
Dropdown
Contains a bar or pie chart that indicates how many times each option is answered and what the percentages are.
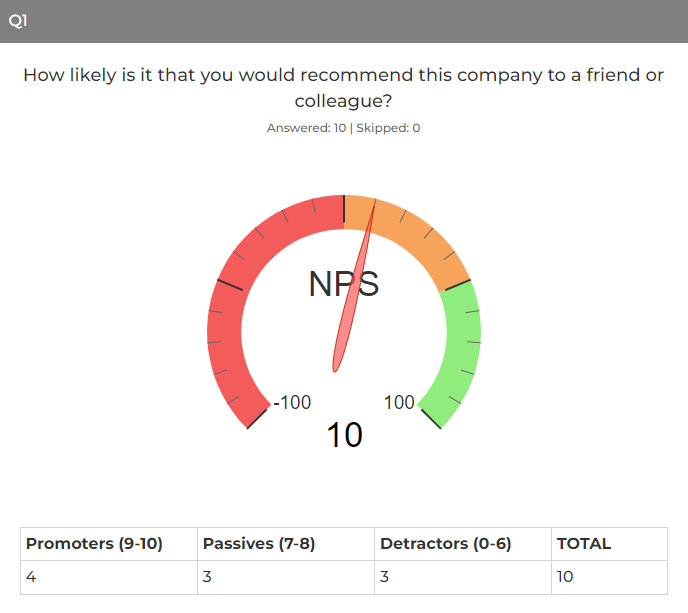
NPS
Contains a gauge bar that indicates the NPS score.
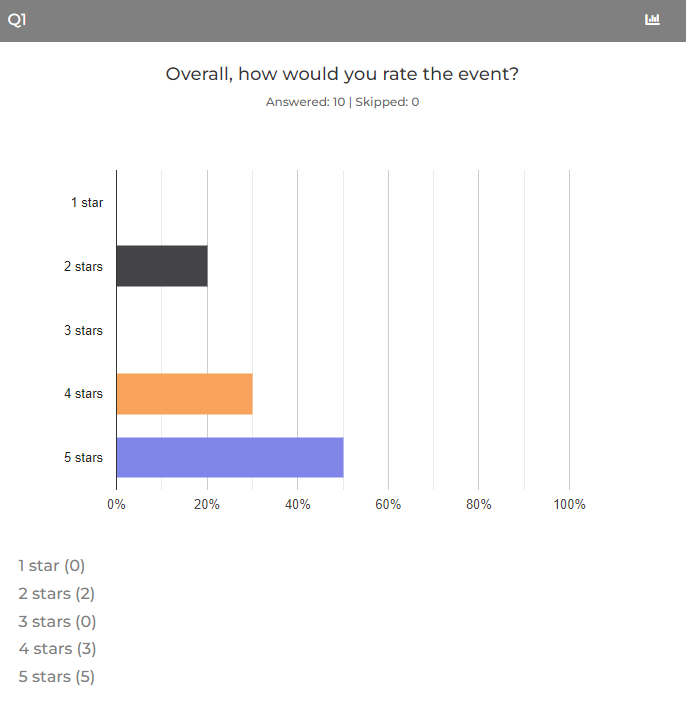
Star Rating
Contains a bar chart that indicates how many times each option is answered and what the percentages are.
Scale
Contains a bar chart that indicates how many times each option is answered and what the percentages are.
Slider
Contains the highest, the lowest, the average and the median values.
Textbox
Contains the most recent answer and likely most comprehensive answer. Sentiment analysis is available.
Comment Box
Contains the most recent answer and likely most comprehensive answer. Sentiment analysis is available.
Date / Time
Contains the most recent answer.
Contact
Contains the most recent answer.
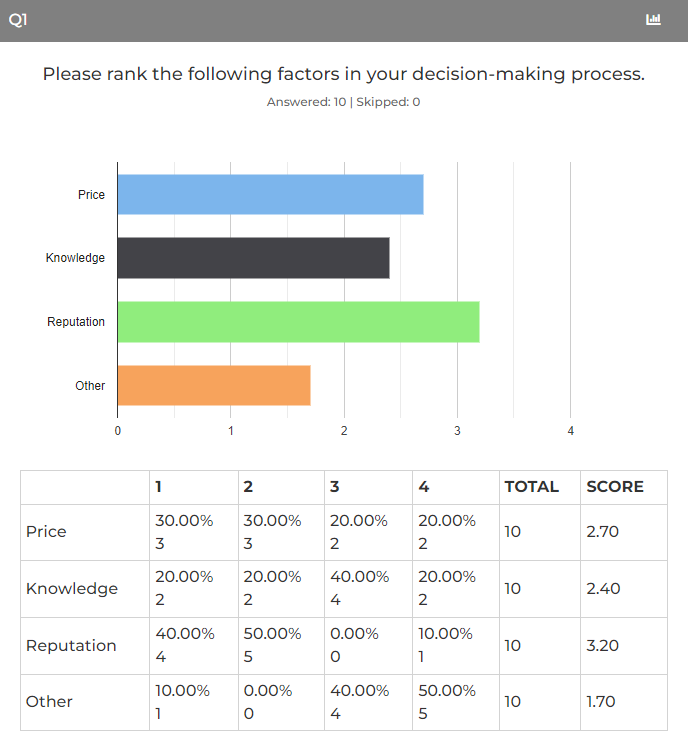
Ranking
Contains a bar chart and a table that indicates how many times each option is answered and the percentages.
Ranking scores will be automatically calculated.
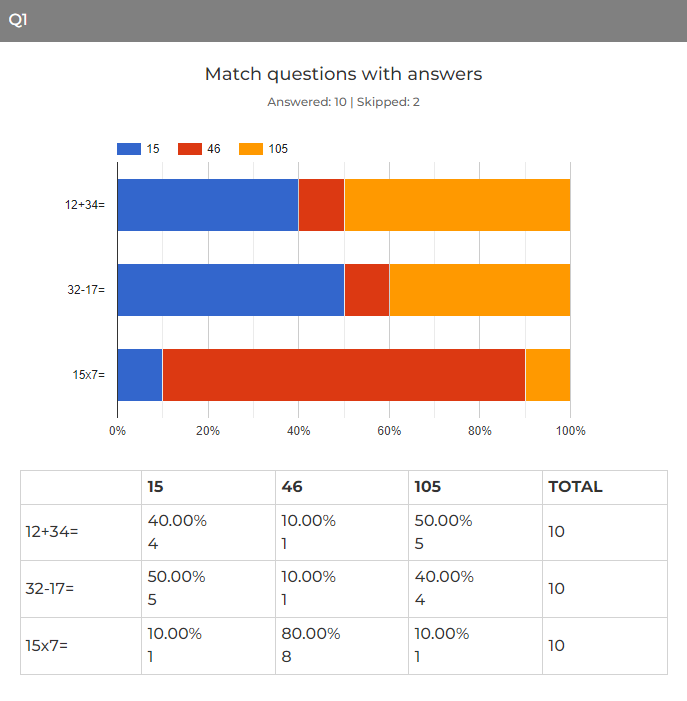
Matching
Contains a bar chart and a table that
indicates how many times each option is answered and the percentages. Ranking
scores will be automatically calculated.
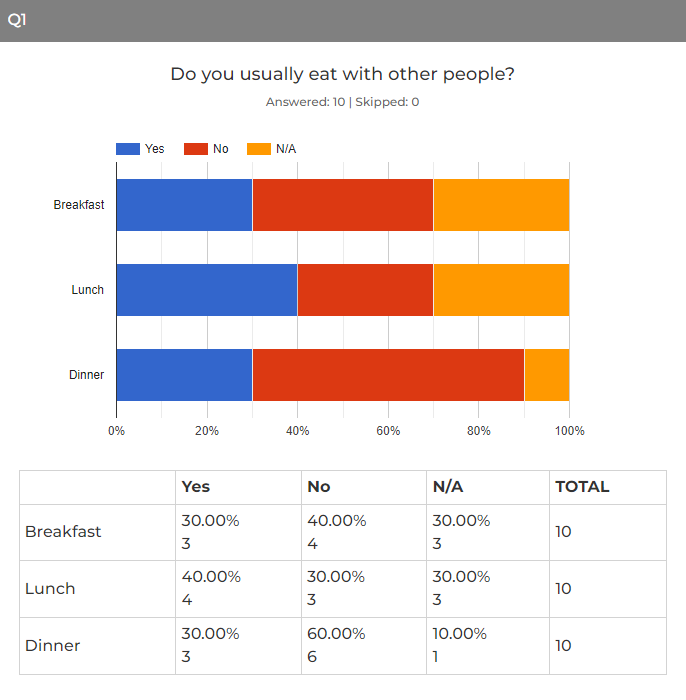
Grid - Multiple Choice
Contains a bar chart and a table that
indicates how many times each option is answered and the percentages.
Grid - Dropdown
Contains multiple bar charts and tables that
indicate how many times each option is answered and the percentages.
For qualified question types, you can click on the Chart Type link to choose from a list of compatible chart types for your question.
Share the article:


Search for articles: