
Crosstab reports allow you to easily compare responses across multiple questions in a grid table. A table shows how many times an answer choice was selected, the Row %, the Column %, and the % of Total. Available question types for cross-tab reports include Multiple Choice (Single-select or Multi-select), Image Choice (Single-select or Multi-select), Dropdown, Net Promoter Score (NPS), Star Rating, Scale, Text A/B Test, and Image A/B Test.
- On the Summary Report page, click on the Crosstab link.
- Choose one or more column questions. Click on the + New Column Question link as needed.
- Choose one or more row questions. Click on the + New Row Question link as needed.
- Check or uncheck the % of Total, Row % and Column % based on your needs.
- Click on the Create Report button.
If you are using a small screen or on a mobile device, adding too many column questions could create a large width to the generated crosstab table. Instead, moving some of your column questions to the row option will give you a more comfortable view.
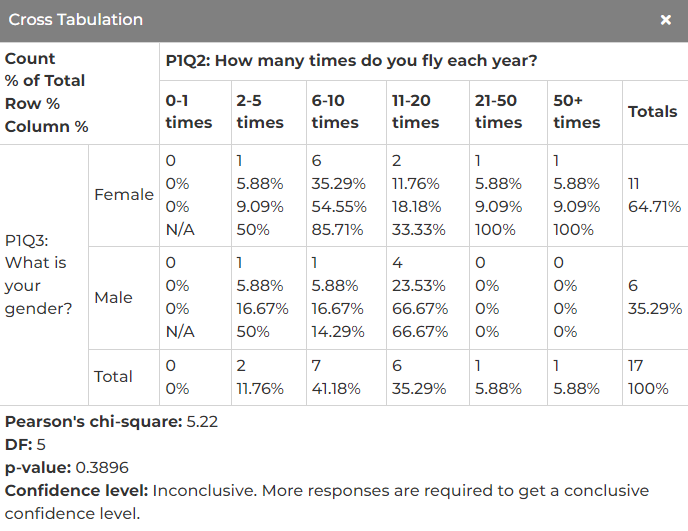
The Pearson's Chi-square & p-value will be automatically calculated and displayed on the page. It can also show you the confidence level and indicate how many more responses are required to get a conclusive confidence level, if needed.
Share the article:


Search for articles: